What does the price of avocados have to do with ninth-grade history?
History depends on evidence, and in today’s world, evidence is data. By doing their own research about the price of avocados and then mining their data, students were able to analyze differences in New York City’s micromarkets and draw conclusions about the economic forces at work.
The assignment was the idea of Darius Weil, a ninth-grade history teacher, who noticed the wide range in avocado prices on his walk home through Upper Manhattan. He pondered the reasons for the differences, and thought it would fun for his students to “explore the city a little bit.”
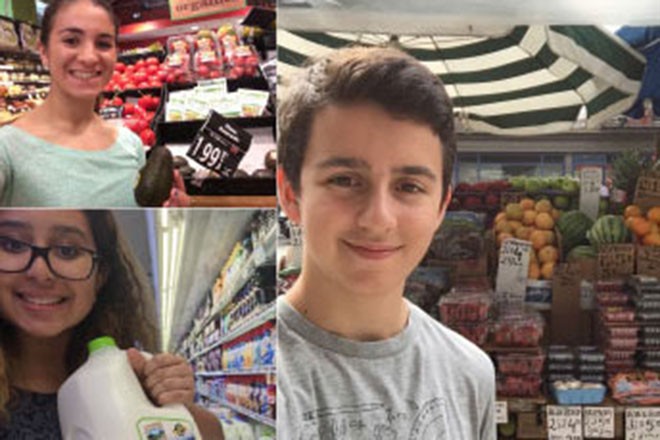
He assigned students to collect the following data points: the prices of an avocado and the cheapest and most expensive gallons of milk at a supermarket near their home; the prices of the same products at another grocery store 20 blocks north and one avenue east or west; and the price of an avocado from a street vendor.
To prove that they actually visited the stores rather than doing the research online, they had to take “selfies” at each location.
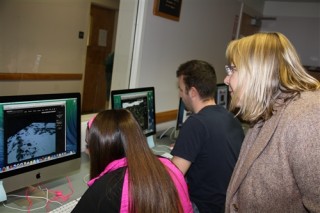
Weil created a Google Form for collecting their data, and then the class used Google Maps to create coordinates for the stores and vendors they visited. Working with the computer science department, Weil learned about a website called cartodb.com that maps datasets. Using a spreadsheet, they were able to create different graphs to analyze the relationship between variables, experiencing the kind of thinking that a social scientist might do.
“What are the factors that determine the prices of commodities? There are so many answers to that question, but my hope was that this particular project would get them to think about how price is determined by real estate values, by the overhead costs of a business, by having to pay employees versus not having to pay employees, by the source of the produce, by the intensity of the competition,” Weil said.