Kindergarteners enrolled at All Saints’ Episcopal School recently donned their math goggles and engaged in a rich, interdisciplinary activity using the visual arts as a lens.
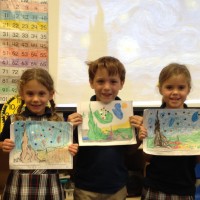
The children learned about and viewed several images of the artwork of Vincent van Gogh, the Dutch Post-Impressionist painter best known for his self-portraits, paintings of sunflowers and irises, and his “Starry Night.”
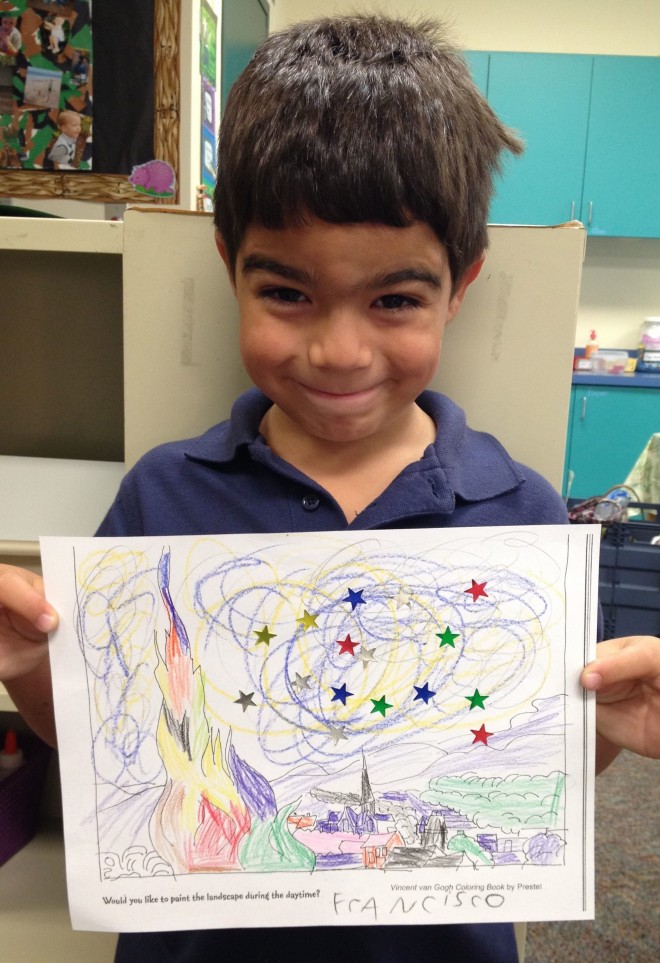
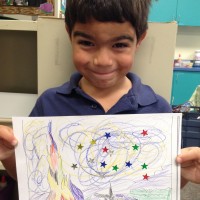
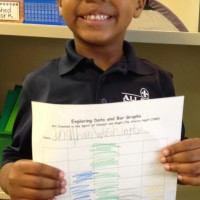
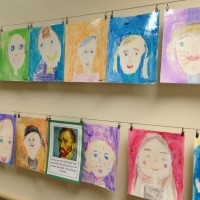
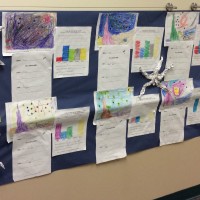
Students first engaged in a visual arts exploration whereby they created their own self-portraits in the spirit of van Gogh, and then they colored their own “Starry Night.” Students decorated their night sky with colored foil stars and then, with their “math goggles” on, they created a bar graph depicting the number of colored stars adorning their night sky. Using their bar graphs, students identified what color stars they had the most of and least of, and they answered a variety of questions in which they compared and contrasted their bar graphs.
Next, students engaged in a creative writing activity in which they responded to the prompts, “On a starry night I see…” and “On a starry night, I feel…”
The activity closed with a reading of “Draw Me A Star” by the famed, prolific author, Eric Carle.
This integrated activity beautifully linked the visual arts, mathematics, reading, and writing. Consider transforming your school hallway into an art gallery, showcasing your students’ mathematical, artistic, and literary masterpieces.